

 Schwarzer Schöps
 Petite Glane
 Cechticky
 Cherio
 Dotnuvele
 Dviete
 Hobol
Hobol La Wimbe
 Pesnica
 Upper Zglowiaczka
 Sävjaan
Meet Kråkstad Catchment - Norwegian Case Study
The Kråkstadelva (sub-)catchment is located within the Vansjø-Hobølelva catchment approx. 30km S-SE of Oslo, Norway. The area of the Kråkstadelva (sub-)catchment is approximately 51 km2. Agricultural land covers approx. 43% of the catchment (22km2) and it is dominated by cereal production. Forest covers approx. 45% of the catchment. Heavy clay soils dominate in the area (up to 80% of clay content). The mean annual temperature is 5.3°C and the average annual precipitation is approx. 864 mm.
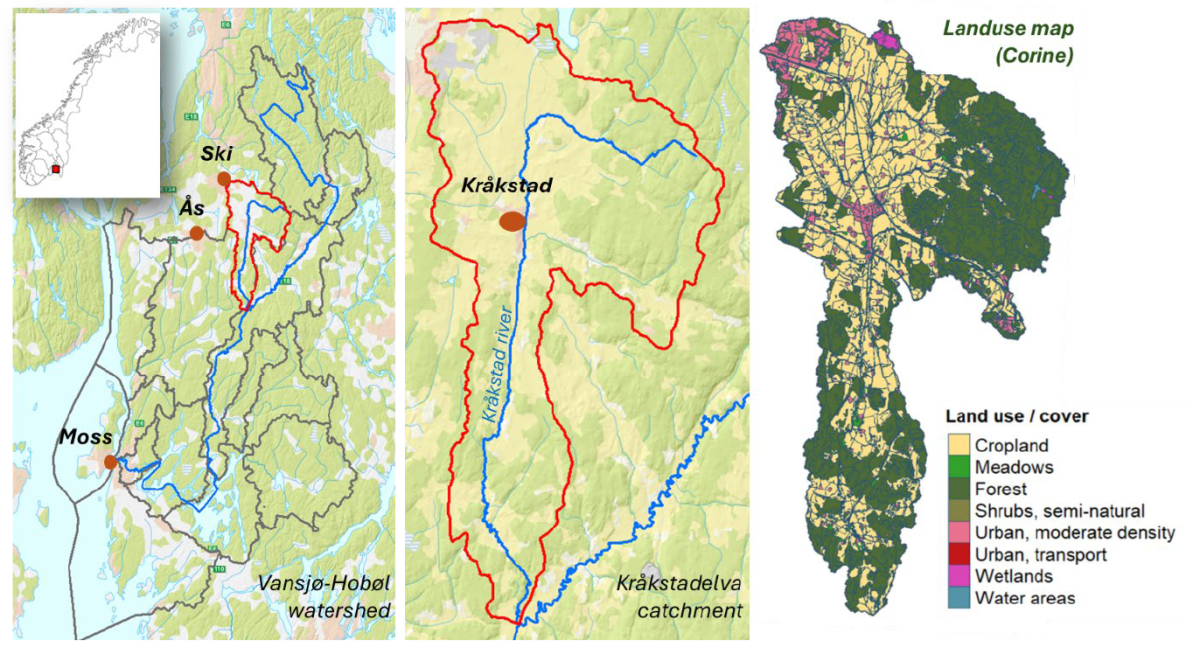
Figure 1: (a) Location of the Kråkstadelva catchment; (b) zoom into the catchment and location of the Kråkstad river; (c) land use type in the catchment according to the CORINE Land Cover classification system
Floods of varied magnitude occur frequently in the catchment, typically during spring snow melt and autumn rainstorms. The main challenge in the area is water quality (including high phosphorus pollution) and soil erosion (including riverbank erosion and quick-clay landslides).
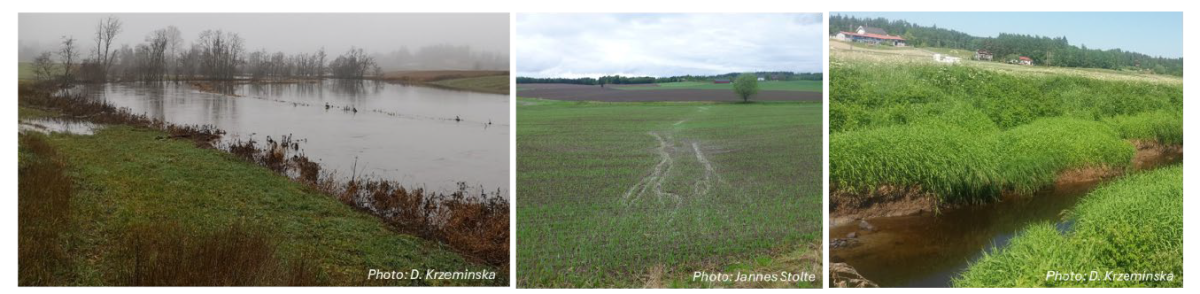
Figure 2: Photos from the Vansjø-Hobøl catchment showing main environmental challenges in the area: flooding and soil erosion, that further results in challenges with water quality.
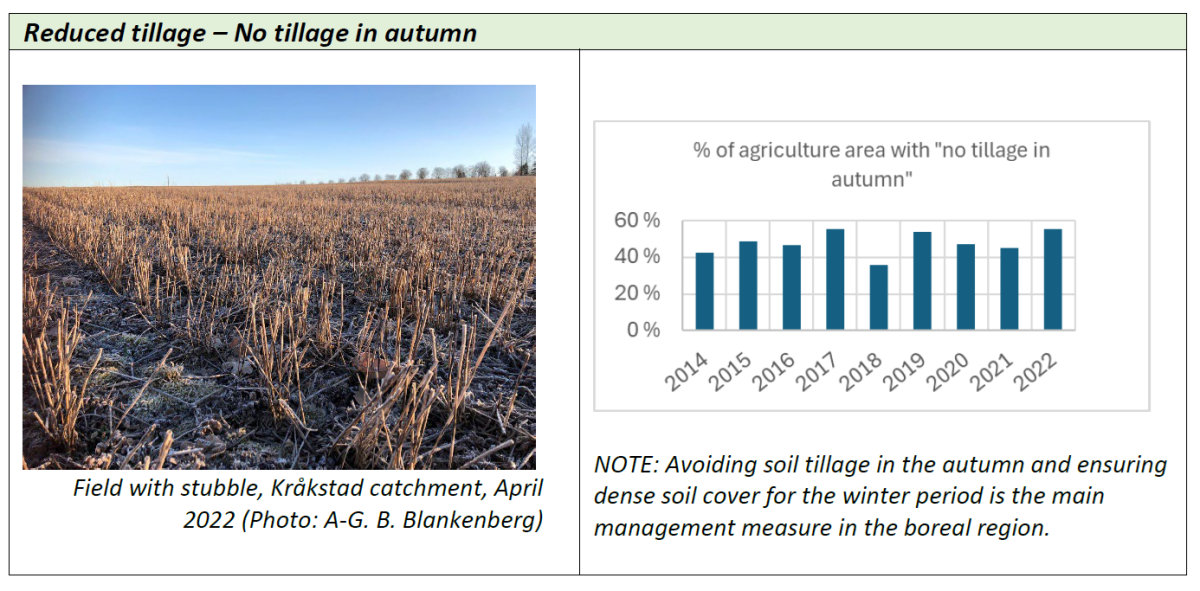
Most soil losses occur during the winter and in early spring in connection with snowmelt processes. With the changing climate, boreal areas face milder winters with an increased number of freeze-thaw cycles which further expose the soil to erosion. Therefore, it is important to minimize soil disturbance during late autumn and avoid leaving the soil surface bare during winter. Avoiding soil tillage in the autumn and ensuring dense soil cover for the winter period are the key management measures in the boreal region.
Stakeholders involvement
The Kråkstadelva (sub-)catchment is part of the Vansjø-Hobøl catchment, one of the most studied catchments in Norway regarding water quality. This is partly because it has served as a pilot area for the implementation of the EU Water Framework Directive (WFD), and also due to recent problems with eutrophication and harmful algal blooms.
Consequently, NIBIO has a strong history of good co-operation with stakeholders in the catchment. We are in contact with the Water Region offices (Vannområde) in the catchment continuously and involved these areas through case studies in several national and international projects. NIBIO recognizes the clear benefit from involving stakeholders at all levels in various projects, and stakeholders give clear feedback that the benefits are mutual
One of the challenges in a busy everyday life is finding time and a suitable meeting venue, NIBIO makes every effort to accommodate stakeholders' preferences for meeting times and locations. Keeping in mind the potential for stakeholder fatigue, we put great effort into ensuring mutual benefits and continuity of our fruitful cooperation also within the scope of OPTAIN project (see the Case Study video).
Natural Small Retention Measures in the Kråkstad catchment
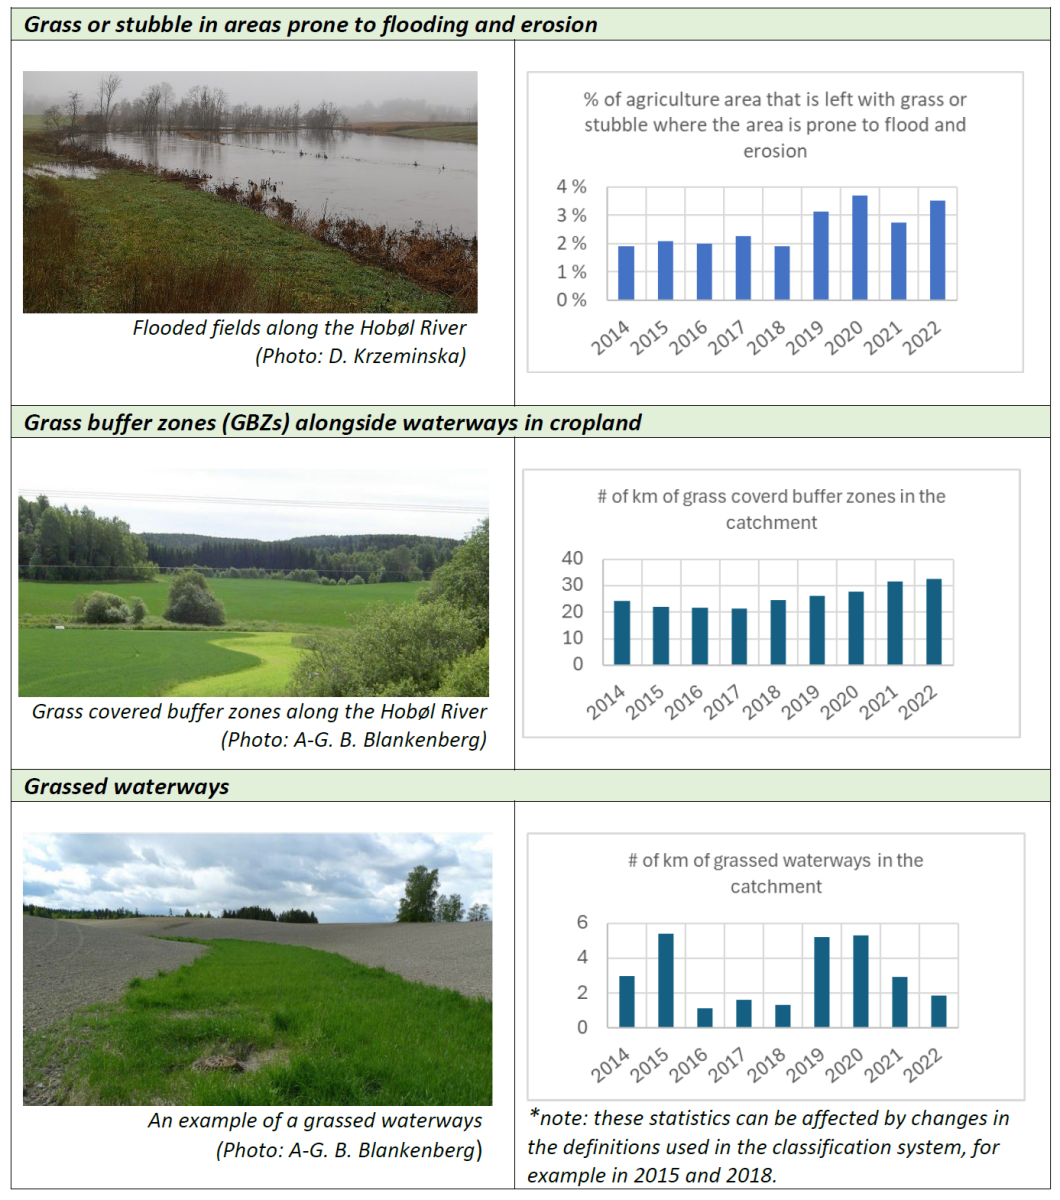
Environmental mitigation measures are already in the focus in the case study area (Tabel 1): low tillage is implemented on approx. 50% of agricultural land in the catchment. An additional 2% of the agricultural land is left with grass or stubbles, where the area is prone to floods and erosion. The area dedicated to buffer zones and grassed waterways has slightly increased over recent years. In 2022, some 24km of grass covered buffer zones aligned the edges of agricultural fields, and approx. 3km of grassed waterways have been registered in the catchment (SSB, Norge. www.ssb.no).
Tabel 1: Examples of different measures already implemented in the catchment (SSB, Norge. www.ssb.no)
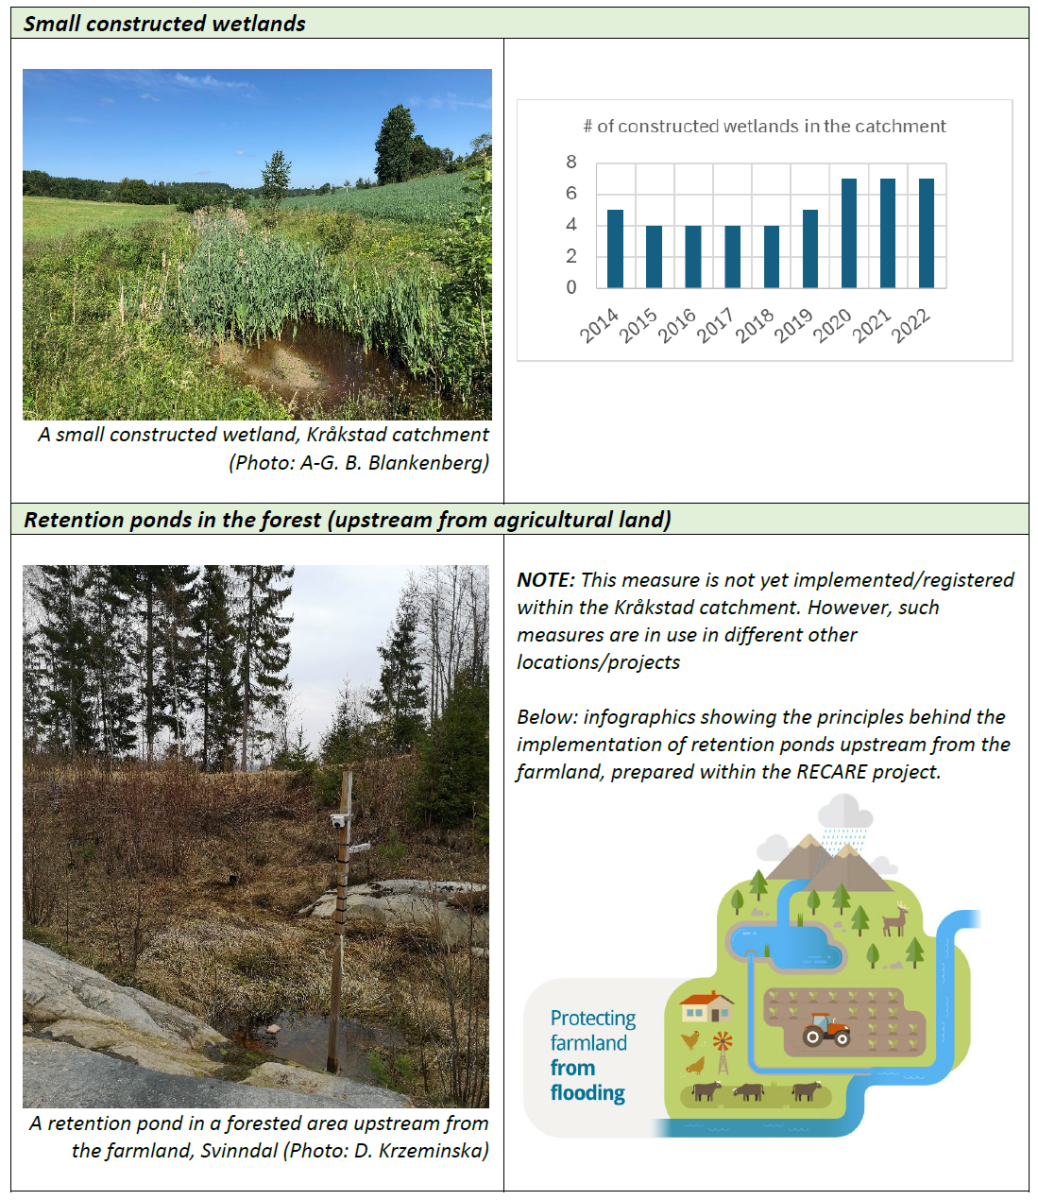
Based on previous studies from the area (Bechmann and Veidal, 2020), we have selected and documented promising Natural/Small Water and Nutrient Retention Measures (NSWRM) (WOCAT database, Norway) that farmers are willing to work with. All these measures are included in the analyses and modeling performed in the OPTAIN project.
What can models tell us/help us with?
The main goal for the Kråkstad (sub-)catchment modeling is to find a range of optimal solutions that ensure both sustainable food production and environmental safety within the catchment, while also accounting for economic consequences. These potential solutions will facilitate discussions with local farmers, as well as agriculture and water managers.
With numerous measures already being implemented in the catchment, it is important to look at their (mutual) effectiveness and explore possible improvements in terms of their combinations, locations, and dimensions.
With numerous measures already being implemented in the catchment, it is important to look at their (mutual) effectiveness and explore possible improvements in terms of their combinations, locations, and dimensions.
To help build possible solutions in the catchment, we have identified all potential locations for each of the measures (e.g. potential locations for new grassed waterways; Figure 3)
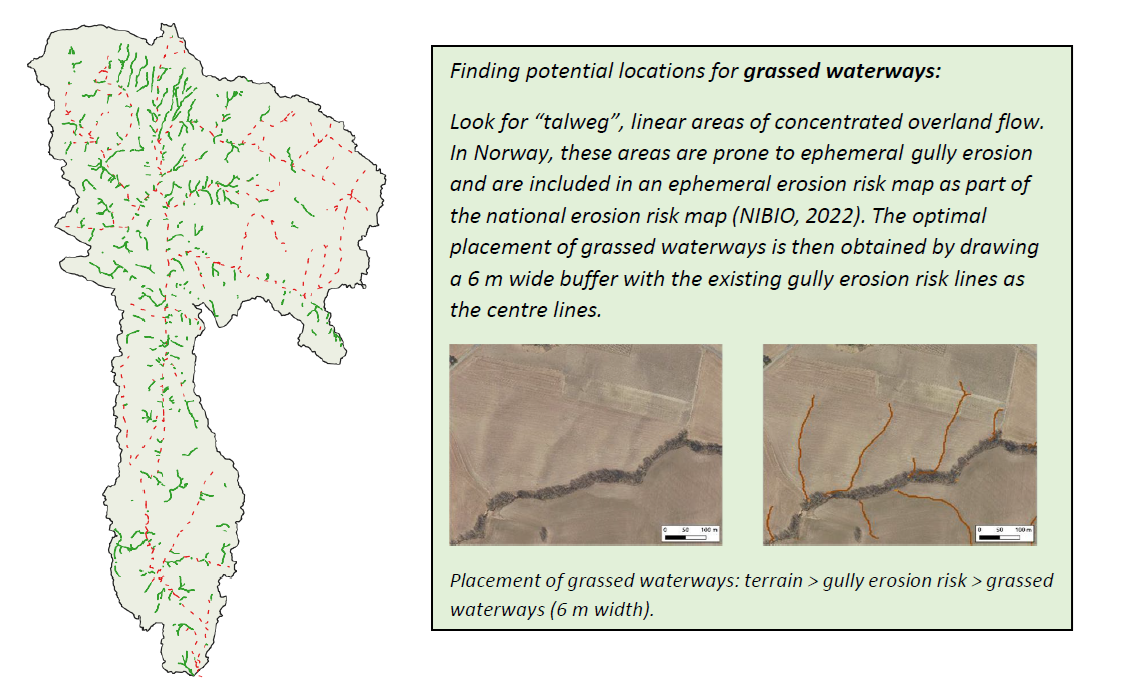
Figure 3. All potential locations for grassed waterways in the Kråkstad catchment and short description of the methodology behind. On the map: green lines indicate potential locations of grassed waterways; red dots indicate locations of streams and rivers.
We modelled scenarios for each type of NSWRM and a combined scenario, assuming that all measures were implemented simultaneously. The examples of information that we can get from modelling are shown in Figures 4 and 5.
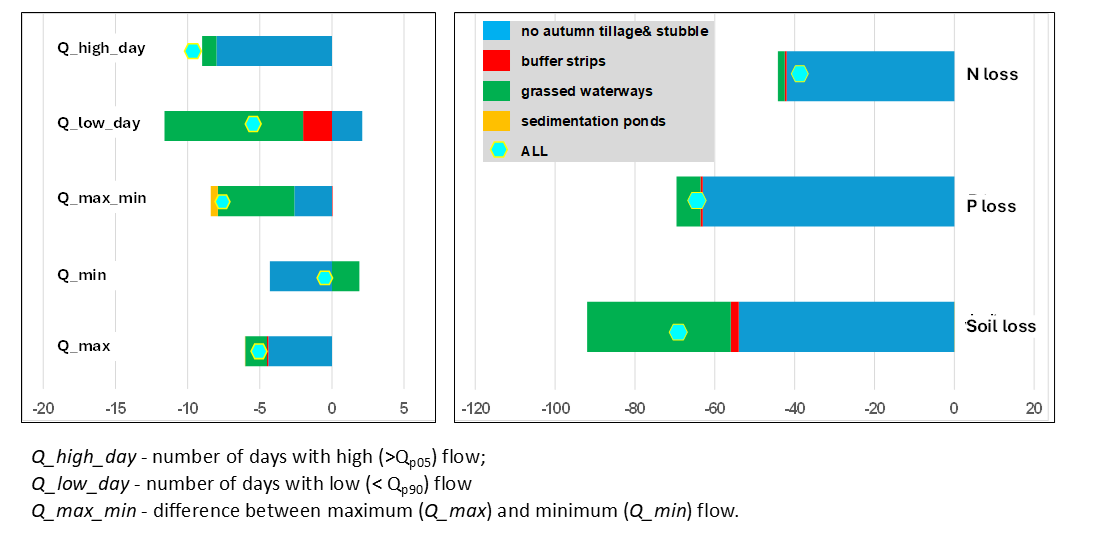
Figure 4. (left) Relevant changes in the hydrological parameters in relation to the base period (%) – measure effects at maximum implementation level. (right) Changes in loss of soil particles and nutrients compared to status quo* (%) – measure effects at maximum implementation level
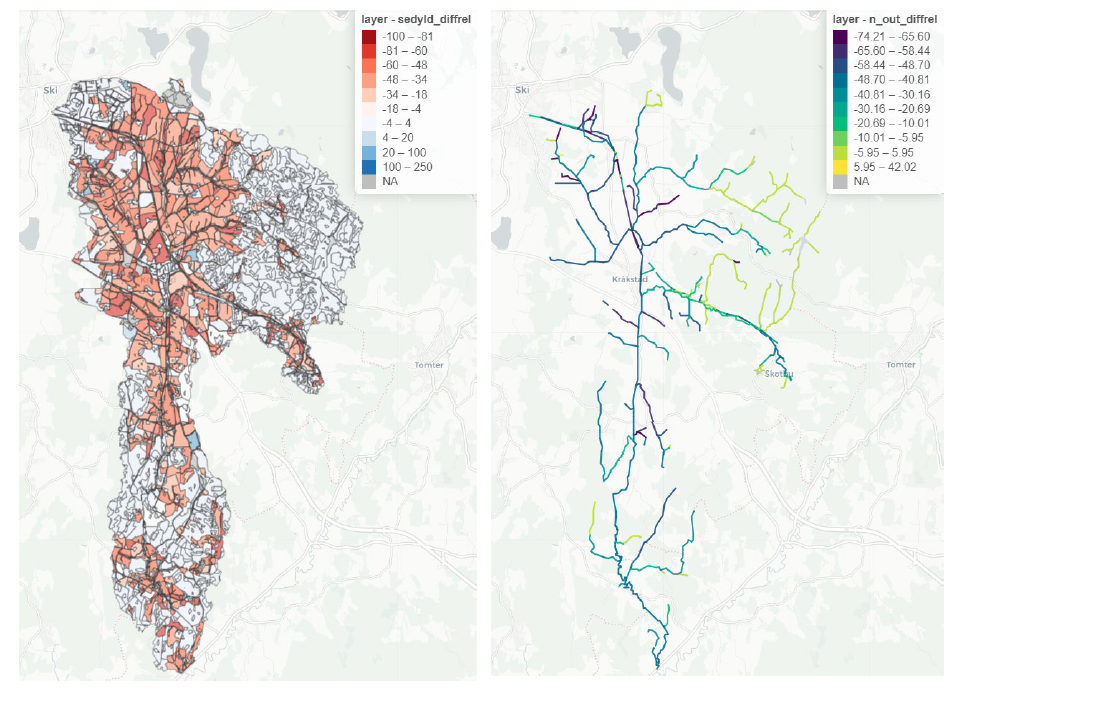
Figure 5. Relative changes in loss of soil particles (%, left panel) and in total N entering the stream system (%, right panel) compared the ‘status quo’* (%) – if implementing no tillage (both in the autumn and spring) and leaving stubble on the soil surface during winter. *status quo is the catchment representation, including the existing measures as it was during the modelled period
The modelling results of all OPTAIN case studies (where available) are reported in project Deliverable 4.4
Optimisation
Figure 6: The landscape has been digitized, now we need to pick which measures we want, and where to place them.
Multiple types of measures, combined with hundreds of potential locations to place them in the landscape gives us a near unlimited set of ways to implement them. The more measures we implement, the better water quality and water retention we may get, but it also quickly becomes expensive, and hard to produce enough food for the country. How does one choose from so many options? This is where our optimisation technique comes into play.
We have run the model hundreds of thousands of times, using a "genetic algorithm" to iteratively improve the method in which measures have been placed in the catchment. Once the algorithm sees no way to further improve the situation, it stops and gives us our results.
However, among nearly unlimited possibilities, there eventually is more than one “perfect” solution, especially if you have more than one goal (like we do in OPTAIN). Therefore, instead of a single way to implement measures in the catchment, we have hundreds, each equally valid, yet trading off one goal for the other. For example, a solution might be to implement numerous measures aiming at securing good water at whatever expenses/costs. Or one might implement only a select few measures (in most promising locations), which have a good impact on the water quality, but still allow for good crop harvests. Examples of these “perfect solutions” from our preliminary results can be seen in Figure 7. Please note that these are preliminary results.
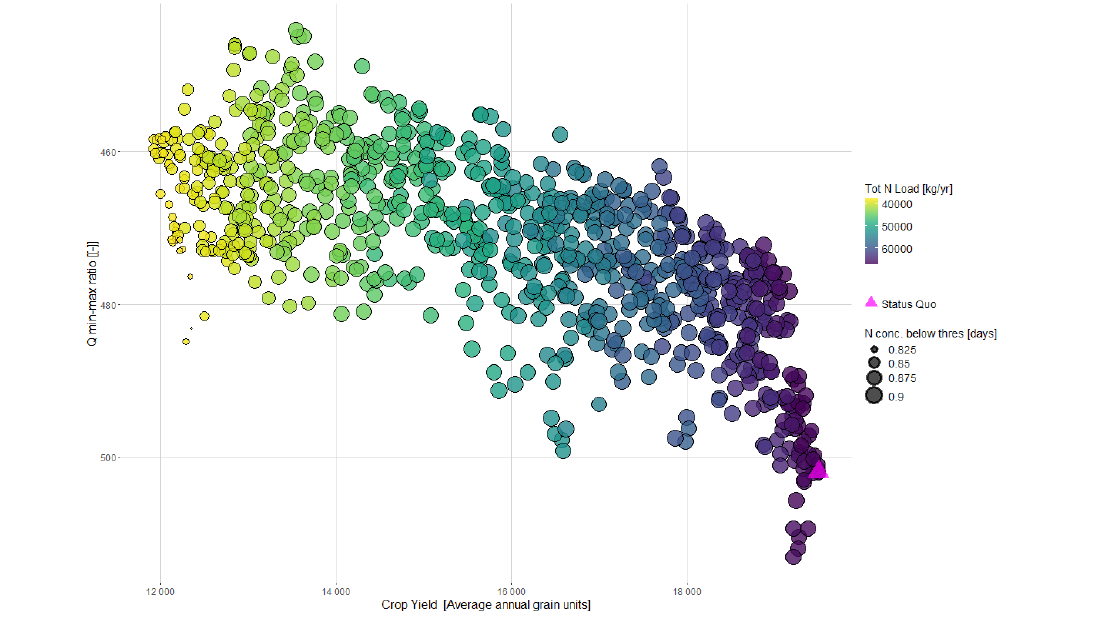
Figure 7: A 4-way optimization moderating river flow (Q min-max), maximizing crop yields, while minimizing nitrogen loads (colors) and nitrogen concentrations (size of dots)
From unlimited potential solutions to only a few hundred is good progress, but no mind can wrap itself around hundreds of different ways to transform a landscape, so can we narrow it down even further? Thankfully yes, through the use of “clustering”. Once we cluster our results based on how similar certain solutions are to each other, we are left with 14 solutions – which is manageable!
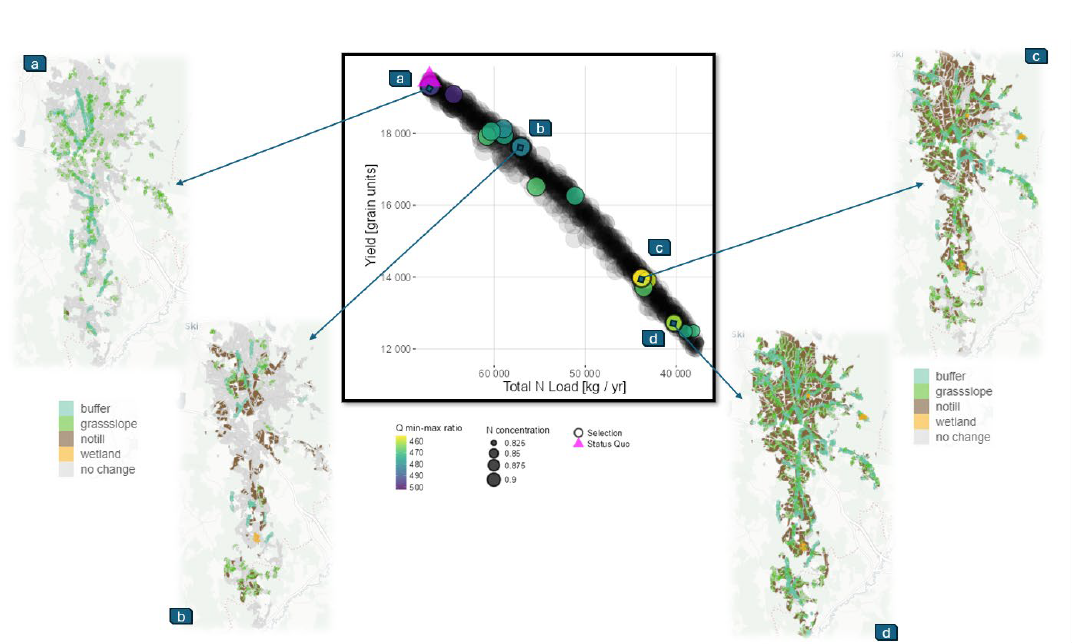
Figure 8: Examples of four out of 14 catchment representations with respect to NSWRMs
Figure 8 illustrates four out of 14 clustered solutions for how to set up our catchment in an optimized manner. In (a) we see a landscape with buffer strips and some grassed waterways, but almost no restrictions on tillage in the autumn – this results in high yields, but poor water retention and water quality aspects. On the other end, (d) contains a landscape with a high degree of measures implementation, especially tillage restrictions in the autumn. This implementation has much lower nitrogen levels, but also much lower yields. Options (b) and (c) make other trade-offs, but are equally as good in terms of benefit-trade-off
The results of the multi-objective optimisation – using also erosion- and soil water content-related indicators – are to be discussed with the local farmers and other stakeholders to help define landscape representations that offer a trade-off between crop production, environmental status and that are acceptable for landowners.
Authors: D. Krzeminska, C. Farkas, M. Shore and A-G. B. Blankenberg